Findings. |
|
Classification
The data set includes entries for 345 institutions. Of these, 262 (76 percent) are active and 83 (24 percent) are inactive. A plurality of entries are for independent institutions. Branch campuses (29 percent) and microcampuses (25 percent) are the second and third most common expressions of degree-granting American higher education abroad. When considering active institutions only, the distribution of classifications generally stays the same. Notably, though, the percentage of microcampuses increases to join independent institutions as the most common form (29 percent each). The actual number of institutions in each category is likely much higher. Figure 1. Classification of all entries in GAHE data set
Operating status
The data set captures institutional closures. Given the high volume of independent institutions and branch campuses overall, it is not surprising that these two categories would also have the most closures. Among inactive entries, 42 percent were independent institutions and 41 percent were branch campuses. Notably, closure figures likely undercount microcampuses. Due to their relatively smaller scale, microcampuses are easier to close than institutions with more substantial infrastructure. Further, the closure of a foreign-provided degree program is not as newsworthy as the closure of a branch campus. The comparative paucity of reporting on microcampus closures generally precludes their inclusion in the data set. Although the data set has identified eight such instances. Location The data set’s 345 institutions span 90 different countries. There are 262 active institutions in 80 countries. A plurality are located in Eastern and South-Eastern Asia (33 percent). This is largely due to the prominence of China, the most common host to American higher education institutions by a wide margin. Europe and Northern America (27 percent) and Northern Africa and Western Asia (20 percent) are also regions populated highly by American higher education institutions. Figure 2. Regional distribution of active entries in GAHE data set
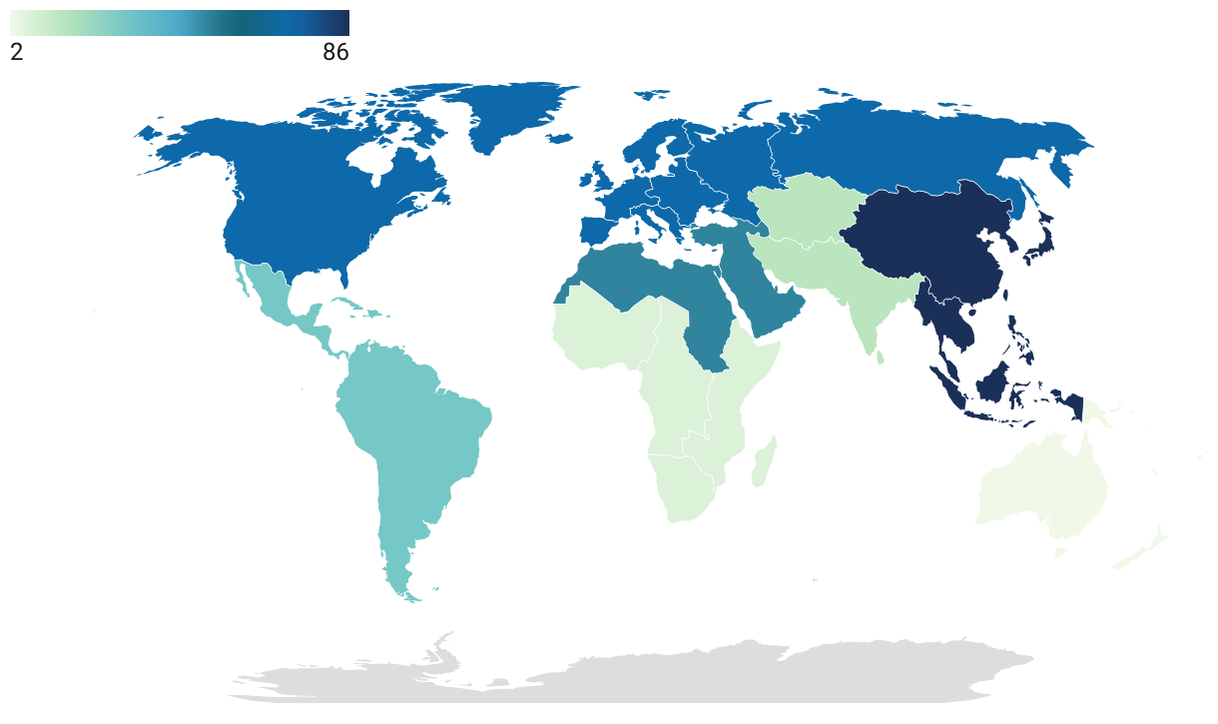
The data demonstrate that the popularity of American higher education models differs by region. Sizable majorities of the world’s American international joint universities (96 percent) and microcampuses (69 percent) are in Eastern and South-Eastern Asia. Nearly half of American branch campuses are in Europe and Northern America (49 percent). A plurality of institutions in the accredited category are in Latin America and the Caribbean (36 percent). Similarly, a plurality of independent institutions are in Northern Africa and Western Asia (33 percent).
Independent American universities are at least a plurality of American higher education institutions in a majority of world regions. Most American higher education institutions in Sub-Saharan Africa (56 percent), Northern and Western Asia (56 percent), and Central and Southern Asia (56 percent) are independent. In Latin America and the Caribbean (38 percent), independent institutions are the most common form of American higher education–largely driven by for-profit medical colleges–but are not a majority. The median country hosts only one American higher institution. But a number of countries have more than one. With the exception of Switzerland and Mexico, which have had a variety of institutional types, high volume countries typically concentrate their forms into one or two categories. In half of the top ten countries, the most common form is the branch campus. In Canada (69 percent), Singapore (70 percent), Greece (60 percent), and Qatar (60 percent), a majority of their American higher education institutions take the form of branch campuses. This model is also a plurality in the United Arab Emirates (41 percent). China has had nearly a hundred different American higher education institutions. Half have been microcampuses and nearly a quarter (23 percent) have been international joint universities. Its 13 independent colleges were closed in the middle of the 20th century. Vietnam also has a high concentration of microcampuses. Ninety percent of its American higher education institutions take this form. Lebanon is the only country in the top 10 that has independent institutions as a plurality, let alone a majority (75 percent). Figure 3. Countries with the most American higher education institutions (active and inactive)
Enrollment
The data set includes approximate enrollment figures for 59 percent of active institutions. These figures suggest that at least 720,000 students are enrolled in active American higher education institutions abroad. Of these, over 600,000 are enrolled in accredited degree programs. These figures are surely undercounted. However, enrollment by institution type is likely inflated. Unless they are required to disclose the information, institutions with low enrollment may not wish to publicly communicate their student body sizes. If these figures were added to the data set, they would likely lower the mean. That caveat aside, the average active institution has nearly 5,000 students. Institutions included in the data set in the accredited category have the highest average enrollment, while microcampuses have the lowest. Figure 4. Average enrollment by institution type
Dates
The data set spans nearly 200 years. Lebanese American University has its roots in the American Girls School established in 1835. Webster University began courses at its new international campus in Tbilisi, Georgia in Fall 2022. Even though there are two centuries’ worth of institutions, the data point to the fecundity of the last quarter century in particular. Among all institutions, the median founding date is 2002 and the median tertiary start date is 2004. Independent institutions appear earliest, followed by branch campuses. Then, by the second decade of the 21st century, accreditation, microcampuses, and international joint universities start to become more popular. Figure 5. Median tertiary start dates by institution type
Other patterns emerge when we look at tertiary start dates by region. American higher education institutions generally appear first in Europe and Northern America. After the turn of the 21st century, they start to diffuse globally. Median tertiary start dates are 2005 or 2006 for Central and Southern Asia, Eastern and South-Eastern Asia, Northern Africa and Western Asia, and Latin America and the Caribbean. The final destinations are Sub-Saharan Africa and Oceania, with median tertiary start dates of 2011 and 2012, respectively. The data set may represent some recency bias. But it does include 15 institutions with tertiary start dates before 1900, 34 institutions offering tertiary programs before 1950, and 87 before the fall of the Soviet Union.
Figure 6. Median tertiary start dates by region
Revenue model
Four in five American higher education institutions abroad operate as not-for-profit institutions. These figures do not change significantly when considering operating status, but they do when factoring in institutional type. The proprietary model is most common among independent institutions. Fully half of all active independent institutions operate for profit. Accreditation Over three-quarters of American higher education institutions abroad are accredited in the United States. Middle States and the Higher Learning Commission are responsible for accrediting most of them. Figure 7. Accreditors of American higher education institutions abroad
Microcampuses are the surest way to get a U.S. accredited degree abroad. Nearly all microcampuses are accredited. The Higher Learning Commission is the most common accreditor of this institutional type. Independent institutions are least likely to be accredited. Only 33 percent of them have achieved U.S. regional accreditation. Forty-eight percent of accredited independent institutions are accredited by Middle States. This accreditor is also the most common accreditor of branch campuses (40 percent).
Figure 8. Accreditation status by institutional type
|